
Professional Traders: Rule 2

John Murphy, Alexander Elder, Toni Turner, Gerald Appel, and Linda Raschke have it figured out and trade equities professionally.
Each of these trading experts comes from diverse professions and backgrounds. John Murphy wrote the text which is used in preparation for the Globally recognized STA designation, Society of Technical Analysts.
Toni Turner was a work-at-home Mom when invited to go to Wall Street and learn to trade on the floor of the New York Stock Exchange.
Alexander Elder was born in Leningrad, served as a ship’s doctor, jumped ship from a Soviet vessel, and was granted asylum in the United States. He trades full-time.
Gerald Appel is the inventor of the MACD, the most popular technical analyst’s market indicator now in use for over 40 years. Raschke gives 50 very good guidelines centered on human nature, behavior, and market psychology.
They’ve published works and have much to share in the way of advice, lessons, and best of all strict rules that a trader should heed to study and master the discipline and art of trading for a living.
Writer’s Contribution
I’m an ex-engineer and full-time trader. My credentials as a trader amount to a steady, accumulation of undocumented expertise. Check out my bio.
What I can do for the reader’s journey is to relate the advice of five professional traders simply, which is saying something. I am able to at least articulate and vouch for their methods, the basis for writing this article.
This story series summarizes the methods and reasoning of these market professionals and what I consider to be 5 strict rules for successful trading.
Basing the Canvas
In the first post of this series providing Pro Traders’ Rule 1, we based our canvas with discussions on two colorful preface questions:
What is Trading?
What information is tradable?
We also delineated Rule 1:
Rule 1: Locate the trend and go with it.
Now, before we dive into Pro Traders’ Rule 2, let’s base our canvas with two more colorful questions, that any reader on this subject might pose.
What is technical analysis (TA)?
Technical analysis (TA) is a method of analyzing a stock or equity using various metrics: price, volume, momentum, and divergences, to predict stock movements and identify trading opportunities. Let’s recall an insightful quote from John Murphy about TA:
The fundamentalist studies the cause of market movement, while the technician studies the effect.
Is the use of TA essential for a trader?
It’s a question that deserves attention. Of the myriad of fundamentals and technical factors having an impact on Apple’s stock (AAPL) just a couple of those Technical Analysis (TA) measurements having impact or effect on AAPL (Apple) stock are its prior price high and prior price low within the pertinent trading time period. We’ll talk more later about what is pertinent.
I’m a chopper pilot. Under clear conditions (VFR), I could fly at 1100 ft. safely without IFR training — to fly in the clouds. However, if I were to fly at 1100 ft. without instrument training, without a pertinent aeronautical chart, and without a recent METAR weather report, I might be unaware of a cloud layer at 1000 ft., not to mention the radio tower in my flight path at 1200 ft. I would pose a serious risk to myself and others. “Flying” in the market without a chart is akin to flying in the clouds — blind.
Like Flying Blind in the Clouds
Knowledge of technical analysis is not required; however, if we were to “fly” into market conditions without doing our due diligence — a quick review of the chart — we pose an unnecessary risk to our accounts.
Likewise, if I went and purchased AAPL on an uncle’s recommendation but never looked at a historical chart showing trends, prior highs, and prior lows, I’m “flying blind” and in fiscal ignorance posing a risk of loss. A stock’s trend, prior high, and prior low are effects of AAPL fundamentals. These elements “report” something about market conditions. These same three elements convey truths about buyers and sellers in AAPL. These elements also have effects on the psyche of major buyers and sellers. Yes, TA is essential to avoid the concept of flying blind in the clouds”.
Regarding John Murphy’s statement, the technician or trader who checks the chart may not be aware of ALL fundamental causes acting on a stock, but a quick study of the chart reveals at least three important things about price: 1) trend, 2) prior high and 3) prior low. In the words of Ron White, “That’s a handy piece of information to have, right there.”
Ron White v. Bar Bouncers:
But I backed down ’cause I didn’t know how many of them it was going to take to whip my ass, but I knew how many they were going to use. That’s a handy piece of information to have, right there. — Ron White
The trader at least knows what effects all fundamentals are having on their stock or equity if they make a cursory check of the stock’s chart.
RULE 2 – Locate the HIGH and LOW of it.
This rule is alluded to by all five experts. John Murphy stipulates the trader should make it a RULE. The importance of the HIGH and LOW Rule 2 is also seen in market theories set forth by the famous mathematician, Fibonacci as used in Elliott Wave Theory. What does this mean?
When trading experts point to “the high and low of it,” they are referring to the prior HIGH and LOW price extremes that a particular asset or security has traded within a given time period. The high and low price levels not only provide insights into market sentiment at these levels, but the intel also tells us something about specific Fibonacci levels in between, which we’ll touch on later. Chart information should at least be used by a trader to identify potential support (buying) and resistance (selling) levels.
How strong is Support and Resistance?
For now, let’s just agree a trader should not arbitrarily assume a stock price will break above selling resistance at the high or break below buying support at the low until it does! There are waves and patterns which are conducive to such a break-out but we’ll not delve into those just yet. Let’s look at a chart:
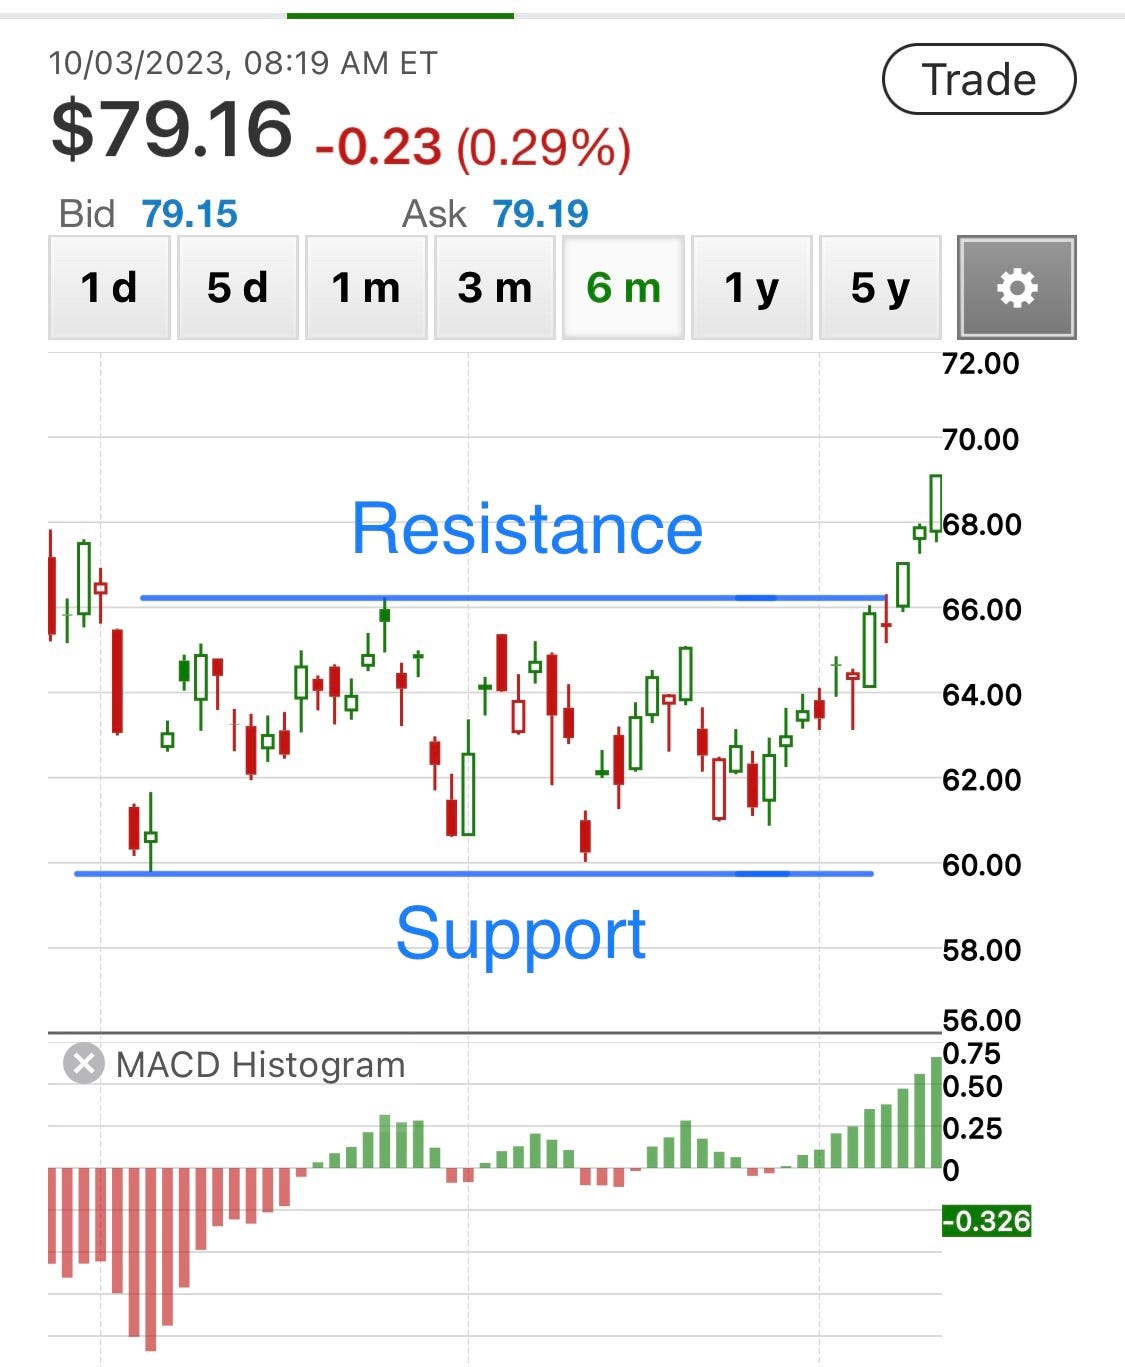
This stock is range bound which suggests we could rely on the 60.00 low as support and buy there. This is true until it’s not; as you see the buy @ 60 and sell at 66 for a 10% gain party doesn’t last forever. The point is to look at the stock chart. Is there a low where the price bounced? Bulls and bears are in agreement.
Takeaway –
Perhaps you recall from our Trending Rule 1 post:
Trading is about timeliness and stacking the odds.
In order to stack the odds, traders will locate the high and low prices to determine the range in which an asset is trading. Resistance levels are where selling pressure increases causing buying to stall or a trend to reverse. Support levels are where buying pressure increases causing sellers to abate. Our five savvy traders recognize the price is likely to trade in the range created by repeated tests of the high and tests of the low. Therefore, a long swing trader will take profits at the prior high resistance(selling) and re-enter a trade at the prior low support (buying).

